gcc/gdb/gprof/gcov/valgrind使用
Table of Contents
gcc编译带符号
-g
-g2
-g3: 最多调试信息  => 最好用这个.
-ggdb: gdb 特有的符号表, 无法被其它调试器使用.
默认情况下,GCC在编译时不会将调试符号插入到生成的二进制代码中,因为这样会增加可执行文件的大小。如果需要在编译时生成调试符号信息,可以使用GCC 的-g或者-ggdb选项。GCC在产生调试符号时,同样采用了分级的思路,开发人员可以通过在-g选项后附加数字1、2或3来指定在代码中加入调试信息的多少。默认的级别是2(-g2),此时产生的调试信息包括扩展的符号表、行号、局部或外部变量信息。级别3(-g3)包含级别2中的所有调试信息,以及源代码中定义的宏。级别1(-g1)不包含局部变量和与行号有关的调试信息,因此只能够用于回溯跟踪和堆栈转储之用。回溯跟踪指的是监视程序在运行过程中的函数调用历史,堆栈转储则是一种以原始的十六进制格式保存程序执行环境的方法,两者都是经常用到的调试手段。
gdb 启动参数
这种用法会报错:
$ gdb ./redis-cli -h 127.0.0.5 -p 22002 --replay /tmp/r/redis-22001/data/appendonly.aof
gdb: unrecognized option '--replay'
Use `gdb --help' for a complete list of options.
可以这样:
$ gdb ./redis-cli -ex 'r -h 127.0.0.5 -p 22002 --replay /tmp/r/redis-22001/data/appendonly.aof'
或者:
ning@ning-laptop:~/idning-github/redis/src$ cat d.gdb
r -h 127.0.0.5 -p 22002 --replay /tmp/r/redis-22001/data/appendonly.aof

ning@ning-laptop:~/idning-github/redis/src$ gdb ./redis-cli -x d.gdb
gdb 查看结构体,格式
直接 p *abc 的话会出来一大团东西,好处是最短的垂直空间内能显示完,坏处是层次结构不好找。
在gdb里运行一下set print pretty on 再输出就是层次结构了。
some ppt for gdb
http://www.slideshare.net/ftt/gdb-2764286 淺入淺出 GDB 中央资工二 张竟.
core dump
$ ulimit -c 1024 $ ulimit -a core file size (blocks, -c) 1024 $ gdb --core=core.9128
此时用bt看不到backtrace,也就是调用堆栈,原来GDB还不知道符号信息在哪里。我们告诉它一下:
(gdb) file ./a.out
gdb 基本使用
gcc -g program.c -o programname
run
(gdb) run arg1 "arg2" ...
continue
^+c
continue
bt
back trace.
list
(gdb) list
3 int main(int argc, char **argv)
4 {
5 int x = 30;
6 int y = 10;
7
8 x = y;
9
10 return 0;
11 }

(gdb) l 17
l -200  显示当前行往前200行处的代码.
break
break LinkedList<int>::remove
break func1
b 27x
watch
watch [var] 当var变动时break

rwatch [var] 当var读取时break

info watch
info
(gdb) disable 2
(gdb) info breakpoints
Num Type Disp Enb Address What
2 breakpoint keep n 0x080483c3 in func2 at test.c:5
3 breakpoint keep y 0x080483da in func1 at test.c:10
info locals
(gdb) info locals
msg = 0x7ffff680feb0
i = 2
没有debuginfo时, 如果是数字, 字符串, 可以试试:
I know that you can find any parameters by looking at a positive offset from $ebp using gdb:

(gdb) x/4wx $ebp
next<over>
(gdb)
Node<int>::next (this=0x0) at main.cc:28
28 Node<T>* next () const { return next_; }
(gdb)
step <into>
(gdb) step
53 Node<T> *temp = 0; // temp points to one behind as we iterate
(gdb)
next will go 'over' the function call to the next line of code, while step will go 'into' the function call.
(gdb) p price[ii]
$7 = 1.1000000000000001
(gdb) p (bst[jj] / price[kk] * 0.97)
$8 = 92380.952380952382
x
examine memory in any of several formats
x/nfu addr
x addr
x
Use the x command to examine memory.
n, f, and u are all optional parameters that specify how much memory to display and how to format it; addr is an expression giving the address where you want to start displaying memory. If you use defaults for nfu, you need not type the slash `/'. Several commands set convenient defaults for addr.

n, the repeat count
The repeat count is a decimal integer; the default is 1. It specifies how much memory (counting by units u) to display.
f, the display format
The display format is one of the formats used by print, `s' (null-terminated string), or `i' (machine instruction). The default is `x' (hexadecimal) initially. The default changes each time you use either x or print.
u, the unit size
The unit size is any of
b
Bytes.
h
Halfwords (two bytes).
w
Words (four bytes). This is the initial default.
g
Giant words (eight bytes).
set
set x = 3
call
call abort()
watch & rwatch
write_watch & read_watch
nexti and stepi
step through my code at the instruction level
disassemble
see the assembly code my program is running:
(gdb) disassemble main
Dump of assembler code for function main:
0x80483c0 <main>: push %ebp
0x80483c1 <main+1>: mov %esp,%ebp
0x80483c3 <main+3>: sub $0x18,%esp
0x80483c6 <main+6>: movl $0x0,0xfffffffc(%ebp)
0x80483cd <main+13>: mov 0xfffffffc(%ebp),%eax
0x80483d0 <main+16>: movb $0x7,(%eax)
0x80483d3 <main+19>: xor %eax,%eax
0x80483d5 <main+21>: jmp 0x80483d7 <main+23>
0x80483d7 <main+23>: leave
0x80483d8 <main+24>: ret
trace stack control
f 0 : 到0对应的栈帧。
cgdb
当遇到断点的时候cgdb就会停下来, ESC进入到source模式,
- j, k ,上下移动行
- space 添加断点。
- i 回到调试模式.
而且可以记忆上次在cgdb session中写的命令.
cgdb比emacs的gdb mode还是有相当的差距的,目前还算可以用,以后也会越来越好吧
xxgdb (gui)
不好用
gdb scripts
Using the GDB Scripts for Analyzing the Data
Suppose that you have a singly-linked list that has strings in it. At some point, you might want to know the contents of the list. To do this, use the GDB scripting instead of adding the debug statements in your code:
#Example for gslist traversal.
define p_gslist_str
set $list = ($arg0)
 while ((GSList *)$list->next != 0)
p (char *)(GSList *)$list->data
 set $list = (GSList *)$list->next
 end
end
document p_gslist_str
p_gslist_str <list>: Dumps the strings in a GSList
end
</code>
Add the above snippet into a file and load it into the GDB as follows:
<code>
(gdb) source /home/jjohnny/scripts/gdb/gslist.gdb
</code>
Now, anywhere you want to take a look in the GSList, simply break and
<code>
(gdb) p_gslist_str server_uid_list
$17 = 0x7fffd81101b0 “7666BC1E000000015870BD1E00000001″
$18 = 0x7fffd810e330 “7666BC1E000000015970BD1E00000001″
$19 = 0x7fffd810cbe0 “7666BC1E000000015C70BD1E00000001″
高级使用
启动load一个脚本
比如调试redis, 每次进入gdb后, 需要 先设置breakpoint, r xxx 来启动, 此时可以把这些命令写入一个文件:
cat d.gdb
r -h 127.0.0.5 -p 22002 --replay /tmp/r/redis-22001/data/appendonly.aof

gdb ./redis-cli -x d.gdb
或者通过在命令行中用 -ex 指定命令
gdb ./redis-cli -ex 'r -h 127.0.0.5 -p 22002 --replay /tmp/r/redis-22001/data/appendonly.aof'
获得某个地址对应的代码::
比如mongodb 会自己打印breaktrace:
532651f65c 0x7f53264fc016 0x7f5326527865 0x7f5326526293 0x7f5326527808 0x7f5326526293 0x7f5326527808 0x7f5326526293 0x7f5
326527808 0x7f5326526293 0x7f5326527261
 /home/ning/mongo/bin/mongod(_ZN5mongo15printStackTraceERSo+0x26) [0xc95896]
 /home/ning/mongo/bin/mongod(_ZN5mongo10abruptQuitEi+0x260) [0x6be1c0]
 /lib64/libc.so.6() [0x318ae32920]
 /lib64/libc.so.6(gsignal+0x35) [0x318ae328a5]
 /lib64/libc.so.6(abort+0x175) [0x318ae34085]
 /home/ning/mongo/bin/../lib64/libtokuportability.so(+0x4327) [0x7f53267da327]
 /home/ning/mongo/bin/../lib64/libtokuportability.so(+0x43a3) [0x7f53267da3a3]
 /home/ning/mongo/bin/../lib64/libtokufractaltree.so(+0xc1299) [0x7f532656f299]
 /home/ning/mongo/bin/../lib64/libtokufractaltree.so(+0x712af) [0x7f532651f2af]
 /home/ning/mongo/bin/../lib64/libtokufractaltree.so(+0x7165c) [0x7f532651f65c]
 /home/ning/mongo/bin/../lib64/libtokufractaltree.so(+0x4e016) [0x7f53264fc016]
 /home/ning/mongo/bin/../lib64/libtokufractaltree.so(+0x79865) [0x7f5326527865]
 /home/ning/mongo/bin/../lib64/libtokufractaltree.so(+0x78293) [0x7f5326526293]
 /home/ning/mongo/bin/../lib64/libtokufractaltree.so(+0x79808) [0x7f5326527808]
 /home/ning/mongo/bin/../lib64/libtokufractaltree.so(+0x78293) [0x7f5326526293]
 /home/ning/mongo/bin/../lib64/libtokufractaltree.so(+0x79808) [0x7f5326527808]
 /home/ning/mongo/bin/../lib64/libtokufractaltree.so(+0x78293) [0x7f5326526293]
 /home/ning/mongo/bin/../lib64/libtokufractaltree.so(+0x79808) [0x7f5326527808]
 /home/ning/mongo/bin/../lib64/libtokufractaltree.so(+0x78293) [0x7f5326526293]
 /home/ning/mongo/bin/../lib64/libtokufractaltree.so(+0x79261) [0x7f5326527261]
怎么获得这些地址对应的 函数呢?
nm:
$ nm ./src/third_party/ft-index/portability/libtokuportability.so | head
0000000000209148 d _DYNAMIC
00000000002093e0 d _GLOBAL_OFFSET_TABLE_
0000000000003e20 t _GLOBAL__I_65535_0_huge_page_detection.cc.o.3766.2377
                 w _ITM_deregisterTMCloneTable
                 w _ITM_registerTMCloneTable
                 w _Jv_RegisterClasses
0000000000004c00 T _Z10os_reallocPvm
0000000000004810 T _Z10toku_fstatiP4stat
0000000000004f10 T _Z11toku_callocmm
0000000000004cd0 T _Z11toku_mallocm
更好的方法:
gdb  lib64/libtokuportability.so --batch -ex 'info line *0x4327'

gdb  lib64/libtokufractaltree.so --batch -ex 'info line *0xc1299'
Line 198 of "/home/xiaobeibei/tokumxSrc/mongo/src/third_party/ft-index/ft/bndata.cc" starts at address 0xc1277 <_ZN7bn_data15get_memory_sizeEv+87> and ends at 0xc12a0 <_ZN7bn_data14verify_mempoolEv>.
gcc
gcc warn 选项
TODO:
-Werror
       Make all warnings into errors.

-Wall (打开大部分检查- 不是所有)
    This enables all the warnings about constructions that some users consider questionable, and that are easy to avoid (or modify to prevent the warning), even in conjunction with macros.  This
    also enables some language-specific warnings described in C++ Dialect Options and Objective-C and Objective-C++ Dialect Options.

    -Wall turns on the following warning flags:

    -Waddress -Warray-bounds (only with -O2) -Wc++0x-compat -Wchar-subscripts -Wimplicit-int -Wimplicit-function-declaration -Wcomment -Wformat -Wmain (only for C/ObjC and unless -ffreestanding)
    -Wmissing-braces -Wnonnull -Wparentheses -Wpointer-sign -Wreorder -Wreturn-type -Wsequence-point -Wsign-compare (only in C++) -Wstrict-aliasing -Wstrict-overflow=1 -Wswitch -Wtrigraphs
    -Wuninitialized -Wunknown-pragmas -Wunused-function -Wunused-label -Wunused-value -Wunused-variable -Wvolatile-register-var

-Wextra(这才是最猛的, 以前是叫"-W ")
    This enables some extra warning flags that are not enabled by -Wall.
    (This option used to be called -W.  The older name is still supported, but
    the newer name is more descriptive.)
-W is now deprecated by -Wextra with new gcc versions.
对部分文件关闭warning:
When using GCC you can use the -isystem flag instead of the -I flag to disable warnings from that location.

So if you’re currently using

gcc -Iparent/path/of/bar …
use

gcc -isystem parent/path/of/bar …
instead. Unfortunately, this isn’t a particularly fine-grained control. I’m not aware of a more targeted mechanism.
gcc编译生成汇编:
gcc -S inline.c -o inline_O0.s
-I, -L -l
-include和-I参数(x.h & path_to_x.h)
-include用来包含头文件,但一般情况下包含头文件都在源码里用#include xxxxxx实现,-include参数很少用。-I参数是用来指定头文件目录,/usr/include目录一般是不用指定的,gcc知道去那里找,但 是如果头文件不在/usr/include里我们就要用-I参数指定了,比如头文件放在/myinclude目录里,那编译命令行就要加上-I /myinclude参数了,如果不加你会得到一个"xxxx.h: No such file or directory"的错误。-I参数可以用相对路径,比如头文件在当前目录,可以用-I.来指定。上面我们提到的--cflags参数就是用来生成-I 参数的
-l参数和-L参数(libx.a & path_to_libx.a )
-l参数就是用来指定程序要链接的库,-l参数紧接着就是库名,那么库名跟真正的库文件名有什么关系呢?就拿数学库来说,他的库名是m,他的库文件名是libm.so,很容易看出,把库文件名的头lib和尾.so去掉就是库名了 好了现在我们知道怎么得到库名,当我们自已要用到一个第三方提供的库名字libtest.so,那么我们只要把libtest.so拷贝到/usr /lib里,编译时加上-ltest参数,我们就能用上libtest.so库了(当然要用libtest.so库里的函数,我们还需要与 libtest.so配套的头文件) 放在/lib和/usr/lib和/usr/local/lib里的库直接用-l参数就能链接了,但如果库文件没放在这三个目录里,而是放在其他目 录里,这时我们只用-l参数的话,链接还是会出错,出错信息大概是:“/usr/bin/ld: cannot find -lxxx”,也就是链接程序ld在那3个目录里找不到libxxx.so,这时另外一个参数-L就派上用场了,比如常用的X11的库,它在/usr /X11R6/lib目录下,我们编译时就要用-L/usr/X11R6/lib -lX11参数,-L参数跟着的是库文件所在的目录名。再比如我们把libtest.so放在/aaa/bbb/ccc目录下,那链接参数就是-L /aaa/bbb/ccc -ltest
静态链接指定的库
比如说我要把mongo-c-driver 的静态.a 静态编译到nginx 里面去.
You could also use ld option -Bdynamic:
gcc <objectfiles> -static -lstatic1 -lstatic2 -Wl,-Bdynamic -ldynamic1 -ldynamic2
All libraries after it (including system ones linked by gcc automatically) will be linked dynamically.
gcc 产生 object文件(只编译)
gcc -Wall -c main.c
其它
nm
The nm(1) command can report the list of symbols in a given library:
ning@pcning:~/idning-paper/src$ nm test/protocol_test.out
08049f18 d _DYNAMIC
08049ff4 d _GLOBAL_OFFSET_TABLE_
08048dbc R _IO_stdin_used
         w _Jv_RegisterClasses
08049f08 d __CTOR_END__
08049f04 d __CTOR_LIST__
08049f10 D __DTOR_END__
08049f0c d __DTOR_LIST__
08048ef4 r __FRAME_END__
08049f14 d __JCR_END__
08049f14 d __JCR_LIST__
08048ede r __PRETTY_FUNCTION__.4058
         U __assert_fail@@GLIBC_2.0
0804a024 A __bss_start
0804a01c D __data_start
08048d70 t __do_global_ctors_aux
08048550 t __do_global_dtors_aux
0804a020 D __dso_handle
         w __gmon_start__
nm输出:
lowercase means that the symbol is local
uppercase means that the symbol is global
T (a normal definition in the code section),
D (initialized data section),
B (uninitialized data section),
U (undefined; the symbol is used by the library but not defined by the library),
W (weak; if another library also defines this symbol, that definition overrides this one).
If you know the name of a function, but you truly can't remember what library it was defined in, you can use nm's -o option (which prefixes the filename in each line) along with grep to find the library name. From a Bourne shell, you can search all the libraries in /lib, /usr/lib, direct subdirectories of /usr/lib, and /usr/local/lib for cos as follows:
nm -o /lib/* /usr/lib/* /usr/lib/*/* \
/usr/local/lib/* 2> /dev/null | grep 'cos$'
Shared Libraries Can Be Scripts
/usr/lib/libc.so on one of my systems:
/* GNU ld script
Use the shared library, but some functions are only in
the static library, so try that secondarily. */
GROUP ( /lib/libc.so.6 /usr/lib/libc_nonshared.a )
- 使用和创建shared library的时候都只需要soname.
- When you install a new version of a library, you install it in one of a few special directories and then run the program ldconfig(8). ldconfig examines the existing files and creates the sonames as symbolic links to the real names, as well as setting up the cache file /etc/ld.so.cache (described in a moment).
自己的一个shared-library的例子
原来只有libevent1.4, 安装了libevent2后 比如:
gcc -o test/protocol_test.gen.o -c -D_DEBUG -Wall -Icommon -I/usr/local/include test/protocol_test.gen.c
gcc -o test/protocol_test.gen.out test/protocol_test.gen.o -Lcommon -L/usr/local/lib -lcommon -levent
但是运行时发现:
ning@pcning:~/idning-paper/src$ ./test/protocol_test.gen.out
./test/protocol_test.gen.out: error while loading shared libraries: libevent-2.0.so.5: cannot open shared object file: No such file or directory
用ldd (list dynamic dependencies)查看:
ning@pcning:~/idning-paper/src$ ldd ./test/protocol_test.gen.out
        linux-gate.so.1 =>  (0x00fb4000)
        libevent-2.0.so.5 => not found
        libc.so.6 => /lib/tls/i686/cmov/libc.so.6 (0x00af5000)
        /lib/ld-linux.so.2 (0x00589000)
这时候有两个办法: 运行前:
$ export LD_LIBRARY_PATH=/usr/local/lib
$ ldd ./test/protocol_test.gen.out
        linux-gate.so.1 =>  (0x00a35000)
        libevent-2.0.so.5 => /usr/local/lib/libevent-2.0.so.5 (0x00abd000)
        libc.so.6 => /lib/tls/i686/cmov/libc.so.6 (0x00110000)
        librt.so.1 => /lib/tls/i686/cmov/librt.so.1 (0x00a01000)
        /lib/ld-linux.so.2 (0x008a5000)
        libpthread.so.0 => /lib/tls/i686/cmov/libpthread.so.0 (0x00bf1000)
编译前:
$ export LD_RUN_PATH=/usr/local/lib
没用..这可能是 solarios上的选项 -Lin Yang 1/11/11 10:17 AM
- ldconfig -这个好使 -Lin Yang 1/11/11 11:19 AM
又例如
在安装libevent2的时候,使用 ./configure 将会安装到/usr/local/下
运行程序的时候出现错误:
[root@localhost src]# ./mds/mds.out
./mds/mds.out: error while loading shared libraries: libevent-2.0.so.5: cannot open shared object file: No such file or directory
这时候需要:
vi /etc/ld.so.conf.d/libevent2.conf
/usr/local/lib
# libevent-2.0.so.5 在这个目录下

ldconfig
然后就好了
参考:
gcov
gcov is a test coverage program how often each line of code executes what lines of code are actually executed how much computing time each section of code uses
When using gcov, you must first compile your program with two special GCC options: -fprofile-arcs -ftest-coverage.
For each source file compiled with -fprofile-arcs, an accompanying .gcda file will be placed in the object file directory. usage:
$ gcc -fprofile-arcs -ftest-coverage tmp.c
$ ./a.out
$ gcov tmp.c
90.00% of 10 source lines executed in file tmp.c
Creating tmp.c.gcov.
The file tmp.c.gcov contains output from gcov. Here is a sample:
-: 0:Source:tmp.c
-: 0:Graph:tmp.gcno
-: 0:Data:tmp.gcda
-: 0:Runs:1
-: 0:Programs:1
-: 1:#include <stdio.h>
-: 2:
-: 3:int main (void)
1: 4:{
1: 5: int i, total;
-: 6:
1: 7: total = 0;
-: 8:
11: 9: for (i = 0; i < 10; i++)
10: 10: total += i;
-: 11:
1: 12: if (total != 45)
#####: 13: printf ("Failure\n");
-: 14: else
1: 15: printf ("Success\n");
1: 16: return 0;
-: 17:}
编译时: -fprofile-arcs -ftest-coverage 链接时: -l gcov
The .gcno file is generated when the source file is compiled with the GCC -ftest-coverage option. It contains information to reconstruct the basic block graphs and assign source line numbers to blocks. The .gcda file is generated when a program containing object files built with the GCC -fprofile-arcs option is executed. A separate.gcda file is created for each object file compiled with this option. It contains arc transition counts, and some summary information.
内存泄漏
Valgrind
valgrind --tool=memcheck --leak-check=full -v --log-file=lighttpd --num-callers=8 ./bin/lighttpd -D -f ./conf/lighttpd.conf
A leak error Message involving an unloaded shared object: 84 bytes in 1 blocks are possibly lost in loss record 488 of 713 at 0x1B9036DA: operator new(unsigned) (vg_replace_malloc.c:132) by 0x1DB63EEB: ??? by 0x1DB4B800: ??? by 0x1D65E007: ??? by 0x8049EE6: main (main.cpp:24)
-g
Valgrind是一个GPL的软件,用于Linux(For x86, amd64 and ppc32)程序的内存调试和代码剖析。你可以在它的环境中运行你的程序来监视内存的使用情况,比如C 语言中的malloc和free或者 C++中的new和 delete。使用Valgrind的工具包,你可以自动的检测许多内存管理和线程的bug,避免花费太多的时间在bug寻找上,使得你的程序更加稳固。 Valgrind的主要功能 Valgrind工具包包含多个工具,如Memcheck,Cachegrind,Helgrind, Callgrind,Massif。下面分别介绍个工具的作用: Memcheck 工具主要检查下面的程序错误: • 使用未初始化的内存 (Use of uninitialised memory) • 使用已经释放了的内存 (Reading/writing memory after it has been free’d) • 使用超过 malloc分配的内存空间(Reading/writing off the end of malloc’d blocks) • 对堆栈的非法访问 (Reading/writing inappropriate areas on the stack) • 申请的空间是否有释放 (Memory leaks – where pointers to malloc’d blocks are lost forever) • malloc/free/new/delete申请和释放内存的匹配(Mismatched use of malloc/new/new [] vs free/delete/delete []) • src和dst的重叠(Overlapping src and dst pointers in memcpy() and related functions) Callgrind Callgrind收集程序运行时的一些数据,函数调用关系等信息,还可以有选择地进行cache 模拟。在运行结束时,它会把分析数据写入一个文件。callgrind_annotate可以把这个文件的内容转化成可读的形式。 Cachegrind 它模拟 CPU中的一级缓存I1,D1和L2二级缓存,能够精确地指出程序中 cache的丢失和命中。如果需要,它还能够为我们提供cache丢失次数,内存引用次数,以及每行代码,每个函数,每个模块,整个程序产生的指令数。这对优化程序有很大的帮助。 Helgrind 它主要用来检查多线程程序中出现的竞争问题。Helgrind 寻找内存中被多个线程访问,而又没有一贯加锁的区域,这些区域往往是线程之间失去同步的地方,而且会导致难以发掘的错误。Helgrind实现了名为” Eraser” 的竞争检测算法,并做了进一步改进,减少了报告错误的次数。 Massif 堆栈分析器,它能测量程序在堆栈中使用了多少内存,告诉我们堆块,堆管理块和栈的大小。Massif能帮助我们减少内存的使用,在带有虚拟内存的现代系统中,它还能够加速我们程序的运行,减少程序停留在交换区中的几率。
Valgrind 使用 用法: valgrind [options] prog-and-args [options]: 常用选项,适用于所有Valgrind工具 1. -tool=<name> 最常用的选项。运行 valgrind中名为toolname的工具。默认memcheck。 2. h –help 显示帮助信息。 3. -version 显示valgrind内核的版本,每个工具都有各自的版本。 4. q –quiet 安静地运行,只打印错误信息。 5. v –verbose 更详细的信息, 增加错误数统计。 6. -trace-children=no|yes 跟踪子线程? [no] 7. -track-fds=no|yes 跟踪打开的文件描述?[no] 8. -time-stamp=no|yes 增加时间戳到LOG信息? [no] 9. -log-fd=<number> 输出LOG到描述符文件 [2=stderr] 10. -log-file=<file> 将输出的信息写入到filename.PID的文件里,PID是运行程序的进行ID 11. -log-file-exactly=<file> 输出LOG信息到 file 12. -log-file-qualifier=<VAR> 取得环境变量的值来做为输出信息的文件名。 [none] 13. -log-socket=ipaddr:port 输出LOG到socket ,ipaddr:port LOG信息输出 1. -xml=yes 将信息以xml格式输出,只有memcheck可用 2. -num-callers=<number> show <number> callers in stack traces [12] 3. -error-limit=no|yes 如果太多错误,则停止显示新错误? [yes] 4. -error-exitcode=<number> 如果发现错误则返回错误代码 [0=disable] 5. -db-attach=no|yes 当出现错误,valgrind会自动启动调试器gdb。[no] 6. -db-command=<command> 启动调试器的命令行选项[gdb -nw %f %p] 适用于Memcheck工具的相关选项: 1. -leak-check=no|summary|full 要求对leak给出详细信息? [summary] 2. -leak-resolution=low|med|high how much bt merging in leak check [low] 3. -show-reachable=no|yes show reachable blocks in leak check? [no]
Valgrind 使用举例
下面是一段有问题的C程序代码test.c:
#include <stdlib.h>
void f(void)
{
   int* x = malloc(10 * sizeof(int));
   x[10] = 0;  //问题1: 数组下标越界
}           //问题2: 内存没有释放

int main(void)
{
   f();
   return 0;
}
1、 编译程序test.c gcc -Wall test.c -g -o test 2、 使用Valgrind检查程序BUG valgrind --tool=memcheck --leak-check=full ./test 3、 分析输出的调试信息:
==3908== Memcheck, a memory error detector.
==3908== Copyright (C) 2002-2007, and GNU GPL'd, by Julian Seward et al.
==3908== Using LibVEX rev 1732, a library for dynamic binary translation.
==3908== Copyright (C) 2004-2007, and GNU GPL'd, by OpenWorks LLP.
==3908== Using valgrind-3.2.3, a dynamic binary instrumentation framework.
==3908== Copyright (C) 2000-2007, and GNU GPL'd, by Julian Seward et al.
==3908== For more details, rerun with: -v
==3908==
--3908-- DWARF2 CFI reader: unhandled CFI instruction 0:50
--3908-- DWARF2 CFI reader: unhandled CFI instruction 0:50
/*数组越界错误*/
==3908== Invalid write of size 4
==3908==    at 0x8048384: f (test.c:6)
==3908==    by 0x80483AC: main (test.c:11)
==3908==  Address 0x400C050 is 0 bytes after a block of size 40 alloc'd
==3908==    at 0x40046F2: malloc (vg_replace_malloc.c:149)
==3908==    by 0x8048377: f (test.c:5)
==3908==    by 0x80483AC: main (test.c:11)
==3908==
==3908== ERROR SUMMARY: 1 errors from 1 contexts (suppressed: 14 from 1)
==3908== malloc/free: in use at exit: 40 bytes in 1 blocks.
==3908== malloc/free: 1 allocs, 0 frees, 40 bytes allocated.
==3908== For counts of detected errors, rerun with: -v
==3908== searching for pointers to 1 not-freed blocks.
==3908== checked 59,124 bytes.
==3908==
==3908==
/*有内存空间没有释放*/
==3908== 40 bytes in 1 blocks are definitely lost in loss record 1 of 1
==3908==    at 0x40046F2: malloc (vg_replace_malloc.c:149)
==3908==    by 0x8048377: f (test.c:5)
==3908==    by 0x80483AC: main (test.c:11)
==3908==
==3908== LEAK SUMMARY:
==3908==    definitely lost: 40 bytes in 1 blocks.
==3908==    possibly lost: 0 bytes in 0 blocks.
==3908==    still reachable: 0 bytes in 0 blocks.
==3908==       suppressed: 0 bytes in 0 blocks.
valgrind有使用方便,容易操作的特点,能够快速的查询出程序的代码占用内存情况,能够有效的找出内存的泄漏的原因,而且是开源。
profiling
gprof
http://www.cs.utah.edu/dept/old/texinfo/as/gprof.h tml#SEC3
gprof基本用法
使用 -pg 选项编译和链接.
执行你的应用程序,使之运行完成后生成供gprof分析的数据文件(默认是gmon.out)。
使用gprof程序分析你的应用程序生成的数据,例如:
gprof a.out gmon.out
gprof 实现原理
gprof并不神奇,在编译和链接程序的时 候(使用 -pg 编译和链接选项),gcc 在你应用程序的每个函数中都加入了一个名为mcount(or“_mcount”, or“__mcount”)的函数,也就是说-pg编译的应用程序里的每一个函数都会调用mcount, 而mcount会在内存中保存一张函数调用图,并通过函数调用堆栈的形式查找子函数和父函数的地址。这张调用图也保存了所有与函数相关的调用时间,调用次 数等等的所有信息。 1. 在内存中分配一些内存,存储程序执行期间的统计数据 2. 在GCC使用-pg选项编译后,gcc会在程序的入口处(main 函数之前)调用 void monstartup(lowpc, highpc) 在每个函数的入口处调用 void _mcount() 在程序退出时(在 atexit () 里)调用 void _mcleanup() monstartup:负责初始化profile环境,分配内存空间 _mcount: 记录每个函数代码的caller和callee的位置 _mcleanup:清除profile环境,保存结果数据为gmon.out,供gprof分析结果 3.在_mcount函数中跟踪程序的执行状况,记录程序代码的执行次数,时间等数据。
使用注意:
1) 一般gprof只能查看用户函数信息。如果想查看库函数的信息,需要在编译是再加入“-lc_p”编译参数代替“-lc”编译参数,这样程序会链接libc_p.a库,才可以产生库函数的profiling信息。 2) gprof只能在程序 正常结束 退出之后才 能生成程序测评报告,原因是gprof通过在atexit()里注册了一个函数来产生结果信息,任何非正常退出都不会执行atexit()的动作,所以不 会产生gmon.out文件。如果你的程序是一个不会退出的服务程序,那就只有修改代码来达到目的。如果不想改变程序的运行方式,可以添加一个信号处理函 数解决问题(这样对代码修改最少),例如: static void sighandler( int sig_no ) { exit(0); } signal( SIGUSR1, sighandler );
当使用 kill -USR1 pid 后,程序退出,生成gmon.out文件。
编译: cc的时候加 -pg
ld的时候加:
/lib/gcrt0.o (或者/usr/lib/gcrt1.o) 现在不需要了. -Lin Yang 6/24/11 11:27 AM
然后运行并且 正常终止 程序
发现生成gmon.out
再:
gprof -z  dist/sbin/mfsmaster dist/localstatedir/mfs/gmon.out

不过我得到的报告都是0:
  %   cumulative   self              self     total
 time   seconds   seconds    calls  Ts/call  Ts/call  name
  0.00      0.00     0.00        3     0.00     0.00  mylock
  0.00      0.00     0.00        1     0.00     0.00  changeugid
  0.00      0.00     0.00        1     0.00     0.00  check_old_locks
  0.00      0.00     0.00        1     0.00     0.00  remove_old_wdlock
  0.00      0.00     0.00        1     0.00     0.00  wdlock
  0.00      0.00     0.00                             __do_global_ctors_aux
  0.00      0.00     0.00                             __do_global_dtors_aux
  0.00      0.00     0.00                             __gmon_start__
  0.00      0.00     0.00                             __libc_csu_fini
可以用kprof打开 dist/sbin/mfsmaster察看(gmon.out要在exe文件的同一目录下.) 我自己用的时候:
mv gmon.out client/
kprof
file / open . client/mount.out
问题
感觉不太靠谱:
ning@ning-laptop:~/idning-github/redis/deps/hiredis$ cc bench1.c libhiredis.a -pg
ning@ning-laptop:~/idning-github/redis/deps/hiredis$ ./a.out
$ gprof  ./a.out ./gmon.out  | vim -

Flat profile:

Each sample counts as 0.01 seconds.
  %   cumulative   self              self     total
 time   seconds   seconds    calls  Ts/call  Ts/call  name
 22.23      0.04     0.04                             redisReaderGetReply
 16.67      0.07     0.03                             redisvFormatCommand
 11.12      0.09     0.02                             redisGetReply
 11.12      0.11     0.02                             sdscatlen
  5.56      0.12     0.01                             main
  5.56      0.13     0.01                             redisBufferRead
  5.56      0.14     0.01                             redisBufferWrite
  5.56      0.15     0.01                             sdsIncrLen
  5.56      0.16     0.01                             sdsempty
  5.56      0.17     0.01                             sdsnewlen
  2.78      0.18     0.01                             sdsMakeRoomFor
  2.78      0.18     0.01                             sdsRemoveFreeSpace
总共7s, 为啥self seconds 加起来不是7s
google-cpu-profile
goolge profile 工具
http://goog-perftools.sourceforge.net/doc/cpu_profiler.html
This is the CPU profiler we use at Google. There are three parts to using it: linking the library into an application, running the code, and analyzing the output.
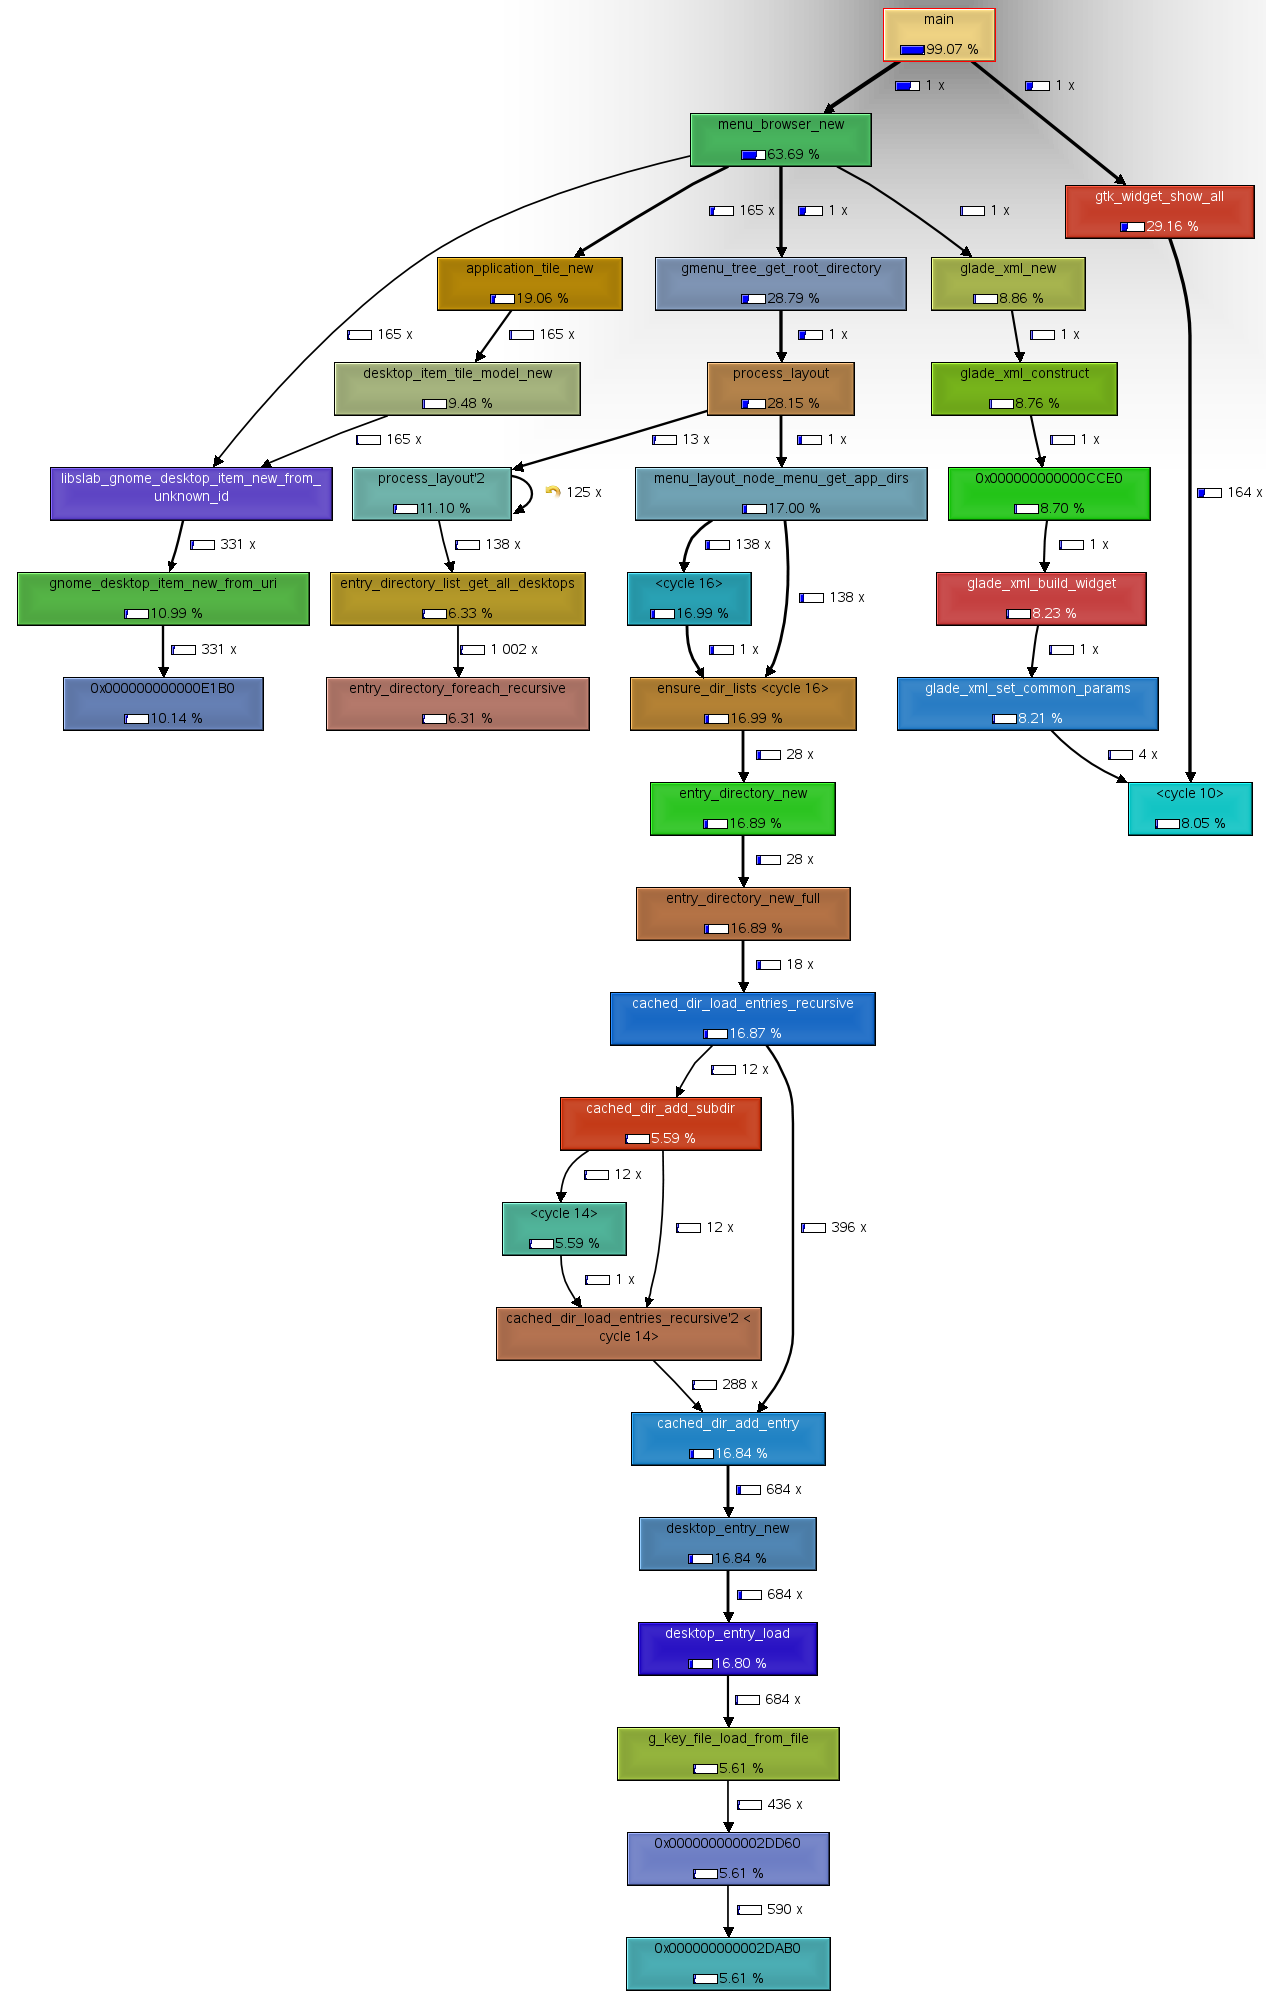
生成调用关系图和时间占用.
安装
- 安装libunwind: http://download.savannah.gnu.org/releases/libunwind/libunwind-1.1.tar.gz
- ./configure --enable-frame-pointers --prefix=/home/ning/local/
使用
链接时加上 -lprofiler, 或者用 LD_PRELOAD (不推荐)
env LD_PRELOAD="/usr/lib/libprofiler.so" <binary>
run:
#In your code, bracket the code you want profiled in calls to ProfilerStart() and ProfilerStop()   (google/profiler.h)
程序需要正常结束.
analysis:
pprof is the script used to analyze a profile.
Linux 2.6 and above, profiling works correctly with threads, automatically profiling all threads
和tcmalloc 是同一个工具集
TC Malloc:
gcc [...] -ltcmalloc
Heap Checker:
gcc [...] -o myprogram -ltcmalloc
HEAPCHECK=normal ./myprogram
Heap Profiler:
gcc [...] -o myprogram -ltcmalloc
HEAPPROFILE=/tmp/netheap ./myprogram
Cpu Profiler:
gcc [...] -o myprogram -lprofiler
CPUPROFILE=/tmp/profile ./myprogram
例子
LD_PRELOAD试用:
#1. 启动
PROFILEFREQUENCY=1000 CPUPROFILE=/tmp/profile LD_PRELOAD=/home/ning/local/lib/libprofiler.so bin/nutcracker -c /home/ning/tmp/r/nutcracker-4000/conf/nutcracker.conf -o /home/ning/tmp/r/nutcracker-4000/log/nutcracker.log -p /home/ning/tmp/r/nutcracker-4000/log/nutcracker.pid -s 5000 -v 4
#起压力
./redis-benchmark.1000 -n 1000 -p 4000 -t mget  -r 1000000000 -c 2

#2.  ^C结束后:
^CPROFILE: interrupts/evictions/bytes = 610/103/4120
$ pprof --text bin/nutcracker /tmp/profile

9470  71.5%  71.5%     9470  71.5% req_error
1040   7.8%  79.3%     1040   7.8% memcpy
 465   3.5%  82.8%      465   3.5% writev
 241   1.8%  84.7%      241   1.8% _msg_get
 171   1.3%  85.9%      171   1.3% msg_send_chain
 142   1.1%  87.0%      142   1.1% mbuf_get
 107   0.8%  87.8%      107   0.8% rbtree_insert
 107   0.8%  88.6%      107   0.8% redis_parse_req
  94   0.7%  89.3%       94   0.7% array_get
  86   0.6%  90.0%       86   0.6% mbuf_remove
  81   0.6%  90.6%       81   0.6% rsp_send_next
  80   0.6%  91.2%       80   0.6% req_done
对性能影响很小.
perf
速度快. 2.6内核提供的. ubuntu, centos都默认安装, 不需要root
perf top:
直接看到热点
perf list:
List of pre-defined events (to be used in -e):

 cpu-cycles OR cycles                       [Hardware event]
 instructions                               [Hardware event]
 cache-references                           [Hardware event]
 cache-misses                               [Hardware event]    可以统计cache-miss噢.
 page-faults OR faults                      [Software event]
有点像strace 对系统调用计数 .
使用:
perf stat -e cycles dd if=/dev/zero of=/dev/null count=100000
attach:
perf stat -e cycles -p 2262 sleep 2
perf top
系统级别top, 哪个函数正在占cpu. 很叼啊!!:
perf top
Events: 4K cycles
 15.14%  libc-2.12.so            [.] memcpy
  6.16%  libc-2.12.so            [.] _wordcopy_fwd_dest_aligned
  4.79%  perf                    [.] 0x412d6
  2.57%  libc-2.12.so            [.] malloc
  2.53%  nutcracker              [.] msg_send_chain                                                 nutcracker
  2.10%  [kernel]                [k] intel_idle
  1.98%  [kernel]                [k] copy_user_generic_string
  1.95%  nutcracker              [.] mbuf_get                                                       nutcracker
  1.81%  nutcracker              [.] rbtree_insert                                                  nutcracker
  1.65%  libc-2.12.so            [.] _int_free
  1.55%  nutcracker              [.] redis_parse_req
  1.50%  nutcracker              [.] req_done
  1.46%  libc-2.12.so            [.] _int_malloc
  1.39%  [kernel]                [k] tcp_sendmsg
  1.23%  nutcracker              [.] rbtree_delete
可以只采样一个 CPU:
perf top -C <cpu-list>

 26.14%  libc-2.12.so        [.] memcpy
  7.69%  nutcracker          [.] mbuf_get
  7.11%  nutcracker          [.] _msg_get
  6.82%  nutcracker          [.] msg_send_chain
  4.40%  [kernel]            [k] copy_user_generic_string
  3.87%  nutcracker          [.] mbuf_remove
  3.79%  nutcracker          [.] req_done
  3.08%  nutcracker          [.] rbtree_delete
  3.02%  nutcracker          [.] rsp_recv_done
  2.54%  nutcracker          [.] rsp_send_next
  1.67%  nutcracker          [.] rbtree_insert
  1.57%  libc-2.12.so        [.] _IO_default_xsputn
  1.50%  nutcracker          [.] msg_get
  1.45%  nutcracker          [.] redis_parse_req
不能只采样某个进程.
callgrind
http://kcachegrind.sourceforge.net/html/Home.html
This is the homepage of the profiling tool Callgrind and the profile data visualization KCachegrind
oprofile
oprofile和Intel的VTune类似,都是利用CPU提供的性能计数功能对系统进行profiling. CPU提供一些性能计数器,经过配置可以对各种事件进行计数,当超过一定的threshold,会发出NMI中断,中断处理程序可以记录下当前的PC,current task等信息。用户可以对其dump进行分析。 采样往往会对系统性能带来一些影响(想想测不准原理),oprofile带来的影响为1%-8%,还好。特别是考虑到它可能是唯一能提供你所需要的信息的工具。
但不需要像gprof一样,必须优雅退出才可以剖分
这就可以开始使用oprofile了,不过需要注意的是,需要有root权限才可以运行,请向>系统管理员索要sudo权限。
对mysqld进行profile为例:
sudo opcontrol --reset
sudo opcontrol --separate=lib --no-vmlinux --start --image=/home/software/output/libexec/mysqld
在其他机器起压力,压力停止后再进行后续操作
sudo opcontrol --dump
sudo opcontrol --shutdown

opreport -l /home/software/output/libexec/mysqld
opannotate -s /home/software/output/libexec/mysqld
systemtap(root)
非常好用.
vtune(root)
Intel® VTune™ Amplifier XE 2013 is the premier performance profiler for C, C++, C#, Fortran, Assembly and Java*.
Intel 提供. 只能用在Intel CPU上.
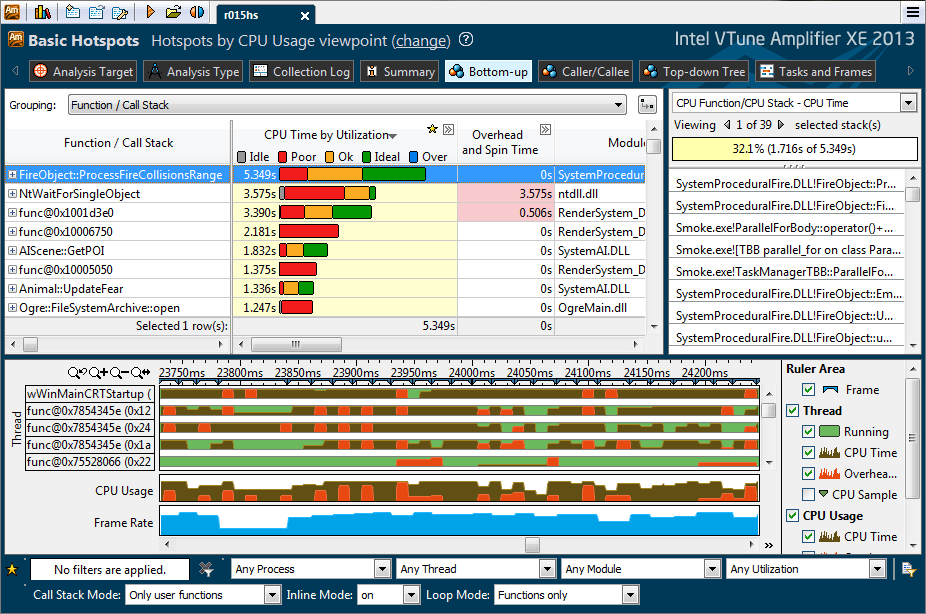
三种数据收集方式:
- Sampling 采样, 打断处理器执行, (如每秒1000次)
- Call graph
- Counter Monitoring
可以在linux上安装Smpling Driver, 启动VTune Server, 在windows 安装客户端.
小结
| 工具 | 需要修改代码 | 正常结束 | 需要root | 影响性能 | 推荐 |
|---|---|---|---|---|---|
| gprof | 0 | 1 | 0 | ||
| google-perf | 0 | 1 | 0 | 1 | |
| callgrind | 0 | 0 | |||
| perf | 0 | 不需要 | 0.5 | 1 | |
| systemtap | 0 | 不需要 | 1 | 1 | |
| oprofile | 0 | 1 | |||
| vtune | 0 | 1 |
- google-perf比gprof简单的一点是, 编译的时候不需要加 -pg.
- google-perf的方法应该和 systemtap 类似, 采样.
推荐使用: - google-perf - systemtap